Thursday, March 19, 2015

Currency's Todays Highlights-


The EURUSD broke higher during the course of the day on yesterday, testing the 1.10 level after the Federal Reserve suggested that perhaps the interest rates in the United States will remain low for a longer amount of time than anticipated. Because of this, we believe that the market will test the 1.10 level again, but we can not forget this fact that there are major issues in the European Union right now. With that, we are a bit hesitant to get involved until we get a clearer signal one way or the other. As of now,it’s better to stay on the sidelines.


GBP/USD


The GBPUSD broke higher during the course of the session after initially falling on yesterday, as we sliced through the 1.50 level. In fact, the surge was massive and as a result we anticipate quite a bit of volatility in this market. However, as the US closes, we are dropping back below the 1.50 level, so right now it looks like the market is still trying to figure out what the US dollar is getting ready to do. With that, we recommend staying out of this market at the moment, as the volatility is too much.


The AUDUSD broke higher during the course of the session on yesterday, testing the 0.79 level. However, we found enough resistance in that general vicinity to withstand the bullish pressure. Alternately, if we get some type of resistive candle in this general vicinity that we are willing to sell. However, we do not have that as of now and we do recognize that the 0.80 level above is a bit of a ceiling, so we are waiting to see whether or not we get a sell signal again, and as a result will remain patient.

USD/JPY

The USDJPY fell hard during the course of the day on yesterday as the Federal Reserve announced its monetary policy, suggesting that perhaps they will have to be patient for longer than anticipated about rate increases. With that, we think that there is still probably an uptrend in a fact, but we may have to be patient and wait for a supportive candle in order to start buying.

NZD/USD

The NZDUSD broke higher during the course of the day on yesterday, breaking above the 0.75 level at one point. Because of this, we need to wait to see whether or not this area holds as resistance, and gives us a nice selling opportunity. As of now, we do not have the right resistive candle, so at this point of time we believe that this market will continue to be very choppy and volatile. We have no interest in buying, but certainly can’t sell. We will let the market come down for a couple of days before placing trades.


Forex Report for Thrusday


Date
Time
Currency
Impact
Particular
Forecast
Previous


ThuMar 19
12:00am
USD
High
FOMC Press Conference


3:15am
NZD
High
GDP q/q
0.80%
0.90%

6:00am
AUD

RBA Bulletin


10:00am
JPY

All Industries Activity m/m
1.90%
-0.10%

12:15pm
CHF

SECO Economic Forecasts


12:30pm
CHF

Trade Balance
2.87B
3.41B

2:00pm
CHF
High
Libor Rate
-0.75%
-0.75%


CHF
High
SNB Monetary Policy Assessment


CHF
High
SNB Press Conference


2:30pm
EUR

ECB Economic Bulletin


Tentative
GBP

10-y Bond Auction

1.62|1.6

Day 1
EUR
High
EU Economic Summit


3:45pm
EUR
High
Targeted LTRO
40.0B
129.8B

6:00pm
USD
High
Unemployment Claims
295K
289K


USD

Current Account
-103B
-100B

7:30pm
USD
High
Philly Fed Manufacturing Index
7.2
5.2

Wednesday, March 18, 2015

NZD/USD Chart wednesday

NZD/USD

The NZD/USD fell during the course of the session on yesterday, as we continued to see bearish pressure. We believe that the 0.73 level is somewhat supportive, but this market should continue to go much lower. We will more than likely try to reach the 0.7150 level, which offered support the last time, but we believe it will break down eventually and let the market head down to the 0.70 level. We believe that rallies will offer selling opportunities, as the 0.75 level above is resistive.

USD/JPY Chart wednesday


USD/JPY

The USDJPY went back and forth during the day on yesterday forming a hammer again. Because of this, the market looks as if it is completely supported below, probably finding a bit of a floor at the 120 level. With that, we believe that we can find buying opportunities every time it dips. We recognize that eventually we will break out to the upside, and once we do so,

AUD/USD Chart Wednesday


The AUDUSD tried to break higher during the course of the session on yesterday, but turned back around to form a shooting star. With that, the market looks as if it’s ready to go much lower, and as a result we believe that this market should then go to the 0.75 level given enough time. We believe that rallies will offer selling opportunities, and that the “ceiling” is somewhere near the 0.80 level, which is a major level on longer-term charts. With this, we continue to sell every opportunity we get.

GBP/USD Chart wednesday


GBP/USD

The GBPUSD broke down during the session on yesterday, slicing back below the 1.48 level. With that, the market looks as if it’s ready to continue going lower, possibly down to the 1.45 level and as a result the market will more than likely be targeting it. Any rally at this point of time will more than
likely find a significant amount of resistance all the way to the 1.50 level, so we are willing to sell resistive looking candles.

EURUSD chart wednesday


EURUSD-
The EURUSD tried to break out to the upside during the session on yesterday but ran into a significant amount of resistance above the 1.06 level. Because of this, the market ended up falling and forming a shooting star, which is a negative sign. We believe that the market will then head down to the 1.05 level, which has been supportive in past. We believe that a break down below there will send the Euro down to the parity level, which is our longer-term target.

Tuesday Forex Technical Report


Forex Report


TueMar 17
12:15am
EUR
High
ECB President Draghi Speaks


1:30am
USD

TIC Long-Term Purchases
27.2B
39.2B

6:00am
AUD
High
Monetary Policy Meeting Minutes


8:34am
JPY
High
Monetary Policy Statement


Tentative
JPY
High
BOJ Press Conference


3:30pm
EUR
High
German ZEW Economic Sentiment
58.9
53


EUR

Final CPI y/y
-0.30%
-0.30%


EUR

ZEW Economic Sentiment
58.2
52.7


EUR

Employment Change q/q
0.10%
0.20%


EUR

Final Core CPI y/y
0.60%
0.60%

6:00pm
CAD
High
Manufacturing Sales m/m
-1.10%
1.70%


USD
High
Building Permits
1.07M
1.06M


USD

Housing Starts
1.05M
1.07M

7:30pm
USD

Treasury Sec Lew Speaks


Tentative
NZD
High
GDT Price Index

1.10%

Tuesday, March 17, 2015

TODAY’S ECONOMIC EVENTS

TODAY’S ECONOMIC EVENTS


Date

Tue Mar 17h
2015
Time (GMT)
Currency
Economic Data
Forecast
Previous
12:30am
AUD
Monetary Policy Meeting Minutes


3:04am
JPY
Monetary Policy Statement


 Tentative
JPY
BOJ Press Conference


10:00am
EUR
German ZEW Economic Sentiment
58.9
53.0


EUR
Final CPI y/y
-0.3%
-0.3%


EUR
ZEW Economic Sentiment
58.2
52.7

12:30pm
CAD
Manufacturing Sales m/m
-1.1%
1.7%


USD
Building Permits
1.07M
1.06M


USD
Housing Starts
1.05M
1.07M

2:00pm
USD
Treasury Sec Lew Speaks


Tentative
NZD
GDT Price Index

1.1%

9:45pm
NZD
Current Account
-3.12B
-5.01B

11:50pm
JPY
Trade Balance
-1.21T
-0.41T

Today's Chart: NZD/CHF


Today's Chart: NZD/CHF ( Hourly )


SUMMARY:

 
SUMMARY:
The major trend of NZD/CHF is bullish. Prices are successfully sustaining on higher levels & consolidating near the important level of 0.7445. The pair is consolidating with strong positive bias and expected to give breakout at upside & can continue its ongoing trend. If NZD/CHF crosses the psychological level of 0.7450 at upside then we can expect it to test the level of 0.7510/0.7550. 

INDICATORS:-
RSI is sustaining in buying territory supporting the upcoming bullish trend in the pair.
Prices are also taking support of 30 DMA & 200 DMA, can show positive side movement for the day.
MACD line is also sustaining in buying territory, indicating the up trend in the market.

STRATEGY:- NZD/CHF is sustaining on higher levels & looking bullish on charts. One can go for buy on dips strategy for this pair for intra day to mid term positions.
 

Tuesday Forex Technical Report


Daily Technical Report
Pivot Points


S3
S2
S1
PIVOT
R1
R2
R3
EUR/USD
1.0312
1.0384
1.0477
1.0549
1.0642
1.0714
1.0807
GBP/USD
1.4628
1.4678
1.4754
1.4804
1.4880
1.4930
1.5006
USD/JPY
120.67
120.87
121.10
121.30
121.53
121.73
121.96
USD/CHF
0.9973
0.9996
1.0037
1.0060
1.0101
1.0124
1.0165
AUD/USD
0.7530
0.7568
0.7605
0.7643
0.7680
0.7718
0.7755
EUR/GBP
0.7010
0.7050
0.7088
0.7128
0.7166
0.7206
0.7244
USD/CAD
1.2644
1.2688
1.2730
1.2774
1.2816
1.2860
1.2902
NZD/USD
0.7213
0.7262
0.7316
0.7365
0.7419
0.7468
0.7522

USD/JPY: Yen hits fresh highs below 121.30 on BOJ Kuroda’s comments

[USD/JPY] Forex Investor Tips-

USD/JPY falls from below 121.37 levels

Currently, the USD/JPY traded unchanged at 121.34, quickly recovering from session lows posted at 121.29 post Kuroda’s comments. The yen strengthened to fresh session highs against the greenback post BOJ Kuroda’s speech which seems to be pro-yen as Kuroda seems optimistic on the overall Japanese economic recovery with wages expected to increase, price trend increasing steadily and indicators of consumer sentiment turning more positive.

Earlier in the session, USD/JPY remained unperturbed by BOJ’s policy decision as markets had widely anticipated that BOJ would keep its monetary policy unchanged. Meanwhile, traders now await US macro data later in the day for further momentum on the pair.

USD/JPY Technical Levels

To the upside, the next resistance is located at 121.67 (March 12 High)) levels and above which it could extend gains 122.03 (March 10 High) levels. To the downside immediate support might be located at 121 levels, below that at 120.24 (20-DMA) levels.

EUR/USD eyeing 1.0600


[EUR/USD] Forex Investor Tips-
 
“The EUR/USD pair witnessed the strongest rise in more than two weeks on Monday as it clocked a high of 1.0618 levels. The technical driven strength in the shared currency was further supported by the disappointing US data, upbeat comments from the ECB President Draghi and disappointing weekly QE purchases number announced by the ECB.”

“The central bank purchased bonds worth EUR 9.751 billion, which is considerably lower than the average EUR 15 billion per week required to achieve its EUR 60 billion per month target. Slow pace of purchases is Euro positive since it means liquidity is being injected at a slow speed.”

“Meanwhile, Draghi, in his speech, noted a sustained recovery in the Eurozone economy. However, caution ahead of the FOMC meeting made sure the pair gave up its gains to trade at 1.0560 levels at the time of writing.”

“A fresh demand for Euros can be anticipated in the range of 1.0530-1.0550, especially if the German Zew survey index prints an optimistic picture about the German economy. Moreover, a strong Zew number, coupled with a stability in the EU CPI in February would support upbeat comments made by Draghi yesterday. In such a case, we could see the pair make another attempt at 1.06 levels.”

“A break above 1.06 could see the pair rise to 1.0650, where a fresh selling pressure could emerge ahead of the FOMC meeting.”

Monday, March 16, 2015

GBP/USD further weakness ahead

“The anticipated GBP weakness exceeded our expectation as it plunged to a low of 1.4699. Strong impulsive downward momentum suggests further weakness for today.”

“A move below 1.4699 could lead to a quick drop to 1.4650.”

“Strong resistance is at 1.4810.”

EUR/USD inching higher, near 1.0530


EUR/USD bounced off 1.0460

The pair has managed to revert a negative start after opening around the 1.0460 region in Asia, recovering some ground along with the offered tone surrounding the USD.

Empty docket in the euro area today will leave the attention to the US releases, with Capacity Utilization, Industrial Production and the Housing Market index gauged by NAHB as the main highlights.

Despite no major announcements are expected, market participants would pay attention to Draghi’s speech tonight in Frankfurt about “The Future of the Finance Industry – Between Growth and Regulation”; followed by a speech by ECB’s Exec Board Member S.Lautenschlager on “Reality Check – How to Foster Growth in the New Regulatory Landscape”, also in Frankfurt.

EUR/USD levels to consider

The pair is advancing 0.19% at 1.0516 and a breakdown of 1.0457 (12-year low Mar.16) would expose 1.0335 (2003 low Jan.2) and then 1.0300 (psychological level). On the flip side, the initial up-barrier lines up at 1.0635 (high Mar.13) ahead of 1.0683 (high Mar.12) followed by 1.0718 (high Mar.11).

Wednesday, March 11, 2015

EUR/USD slumps to lowest since Feb 2003 below 1.05

EUR/USD slides from 1.0514 levels

The EUR/USD now trades at 1.0509 levels, recording a loss of -0.35% on the day, having slipped fresh multi-year lows at 1.0496 levels few minutes ago. EUR/USD tumbled to fresh twelve year low and heads lower within reach of parity as the US dollar continues to be heavily bid across the board. Diverging monetary policy outlooks between the US and the Europe keeps the reserve currency boosted against the euro.

The US dollar index which measures the relative strength of the greenback against a basket of six major currencies jumped to fresh twelve year highs at 100.05 and now trades at 99.96 levels, recording a 0.31% gain on the day.

Meanwhile, traders continue to closely monitor Greek negotiations ahead of its EUR 350bn to IMF tomorrow. Also, a host of US data including retail sales and unemployment claims numbers may provide fresh incentives for the main currency pair.

EUR/USD Technical Levels

The pair has an immediate resistance at 1.0553 (Today’s High) levels, above which gains could be extended to 1.0600 levels. On the flip side, support is seen at 1.0496 (Today’s Low) levels, below which it could extend losses to 1.0450 (Feb 2003) levels.

EUR/USD decline accelerates further

“The EUR remains under pressure as the ECB’s bond buying programme boosts liquidity and pushes down European yields”.

EUR/USD declined another 1.5 figure yesterday and dropped below 1.07 and while the cross looks increasingly oversold both technically and valuation wise, we could see further USD buying ahead of the FOMC meeting next week as the market positions for a more hawkish Fed”.

“We target EUR/USD at 1.05 in 6M but we stress that risks are tilted to the downside relative to our forecast”.

Monday, March 9, 2015

Asia Recap: USD has no rivals, key breakouts

[FOREX News] AUD/USD saw a gradual and steady decline since the get-go, with technicals communicating bearish continuation and the NAB Monthly Business Survey for February 2015 exacerbating the pain, as the market learnt that business confidence deteriorated further from 3 to 0 even after the RBA rate cut.

China Consumer Price Index (MoM) came above expectations (0.8%) in February, with the actual at 1.2%, while the yearly stood at 1.4% vs 0.9% expected. While there were some comments that improved inflation data may provide the PBOC some scope to hold off from further easing, the pick up in inflation is thought to be temporary, with its main contributor being the Chinese new year period, according to the Chinese Bureau of Statistics.

NZD/USD traded heavy following news that Fonterra trading had been halted in its dairy industry entities, due to a threat made to contaminate infant milk formula, NZ police reported, despite no signs of any contamination. Even New Zealand's Minister of Primary industry said New Zealand infant formula "just as safe today as it was before". NZD/USD registered its lowest at 0.7275.

USD/JPY kept roaring higher, making fresh trend highs at 122.00, breaking marginally its former peak at 121.82 from early Dec 2014. The rise was driven by USD strength across the board, with leveraged names main suspects riding the pair up, with 122.00 expected to provide enough 2-way money negotiations to potentially close some of the long deals being carried from 120.00+.

EUR/USD: below 1.0750 targets 1.0730/25 –

[FOREX News] “We do look like the market will head to the 2003 lows of 1.0765....Now given that the market is drastically oversold this support should hold.”


“Difficult to buy into such a weak market, therefore only do it for a very short time on a correctionary basis only.”

“Below 1.0750 and we are out of longs, back into shorts looking for further weakness down to 1.0730/25 then 1.0690.”

“Today our daily pivot is at 1.0860 which so far has held the overnight high..Europe may well come in and re-test this resistance...Any long positions to be covered to here.”

USD/JPY break above 121.85 targets 123.00

[FOREX News] “As we highlighted yesterday, the break of the key 120.50 resistance last Friday signals the start of a bullish USD phase targeting last year’s high near 121.85.”

“In line with our expectations, USD continues to gain ground touching a high of 121.60 as of the time of writing.”

“Upward momentum is clearly very strong at this stage and a move above 121.85 will shift the focus to 123.00.”

“Trailing-stop is still at 119.60 for now but 120.30 is already a strong support.”

Sunday, March 8, 2015

Barclays: Little to disturb the EUR downtrend

[FOREX News] "The ECB is scheduled to begin purchases of European Government Bonds under its recently expanded asset purchase programme on Monday.”

“The Eurogroup meeting (also Monday) will be mostly devoted to Greece and provide an opportunity for progress on planned reform but a formal agreement remains unlikely at this stage.”

“In terms of data, we look for euro area industrial production (Thursday) to increase 0.3% m/m in January (consensus: 0.2%) consistent with recent business surveys showing a minor improvement in the manufacturing sector"

"However, as we have noted previously, we do not believe a stabilisation of euro area activity will be enough to support a rally in EURUSD in the context of diverging ECB-Fed monetary policy and widening EU-US real interest rate differentials"

Gold recovers from 3-month lows

[FOREX News] Gold holds above 1170 levels

Currently, gold trades 0.30% higher at 1170.60 levels, bouncing-off session lows at 1167.47 levels. Gold prices suffered its fifth weekly drop in the past six, as QE on EZ and a solid monthly US jobs report drove the US dollar to its strongest level in over a decade. Surprisingly strong US jobs data put the risk of a mid-year Fed hike back on the table, dent demand for non-interest-bearing yellow metal, dragging its prices lower.

Moreover, in signs of lack of investors’ confidence in gold, SPDR Gold Trust, the world's largest gold-backed exchange-traded fund, said its holdings fell 0.59 percent to 756.32 tonnes on Friday.

Gold Technical Levels

The metal has an immediate resistance at 1174 (hourly 20-DMA) and 1180 levels. Meanwhile, support stands at 1167.47 (Today’s low) levels below which doors could open for 1163 (March 6 Low) levels.

Japan Q4 recovery slower than expected

[FOREX News] “Japan Q4 final GDP q/q: 0.4% v 0.5%e; Annualized GDP: 1.5% v 2.2%e; nominal GDP: 1.0% v 1.1%e; confirms emergence from technical recession”

“Japan Feb bank lending (incl trusts): 2.5% v 2.5% prior; bank lending (ex- trusts): 2.6% v 2.6%e”

“Japan Jan current account: ¥61.4b v ¥270be; adj current account: ¥1.06t v ¥1.18te; trade balance: -¥864b v -¥936be”

“Japan Cabinet Office released the final Q4 GDP data that confirmed the economy emerged out of recession, but did so at a slower than expected pace.”

“Private consumption component was up 0.5% - ahead of 0.3% prelim and consensus - but corporate sentiment remained cautious, as investment contracted by 0.1% again vs expected 0.2% pickup.”

“Japan Chief Cabinet Sec Suga spoke after the release, noting economy is still on recovery track. Likewise, BOJ Dep Gov Nakaso remarked the trend toward achieving the 2% inflation target is more important than the pace, although he still expects to reach that goal some time in FY15 unless oil prices continue to pull CPI lower.”

Thursday, January 29, 2015

Four Stock Market Swing Trade Ideas

Swing trading is a trading style focused on capturing momentum moves over the course of days or weeks. Swinger traders are usually attempting to capture one or two waves of a price move, instead of the entire trend, which could last for months or years. There are multiple ways to find swing trades, including breakouts, the aftermath of news events or announcements, or bounces off support or resistance. Here are four potential swing trades based on a variety of market conditions. 
 
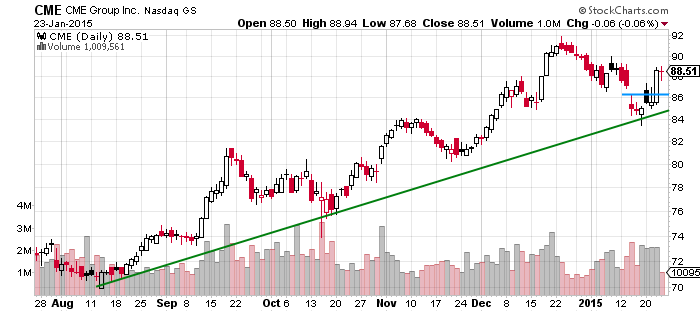
CME Group Inc. (CME) has been rallying in a trend channel since August, and it recently bounced off channel support near $85. The price moved aggressively higher off this level on Jan. 22, so wait for a pullback between $86.25 and $85.75 to buy. Waiting for a pullback may mean missing a trade, but it makes the risk/reward on the trade much more attractive. Place a stop loss below the Jan. 16 swing low of $83.43. A conservative target is $92.60, which is below the Dec. 23 high of $93.91. A more aggressive target is $94.40, just above the former high.

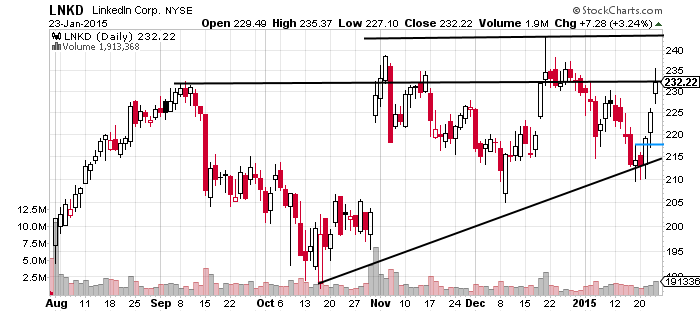
LinkedIn Corp. (LNKD) is moving into the resistance zone of a triangle pattern which started in September. The top of the triangle has been tested three time and isn't well defined, forming a resistance area between $232 and $243.25. Because of this wide resistance area, a legitimate breakout level is harder to pinpoint. In such cases, here are two possible ways to trade the triangle. The first is to wait for a pullback and try to buy near triangle support at $216. Alternatively, if the price breaks above $243.25, and it runs to at least $250, then buy a pullback near the original breakout point of $243. If the price ultimately does break above the triangle the target is $275, with a more aggressive target of $295. A stop loss on the long position(s) goes below the most recent swing low.

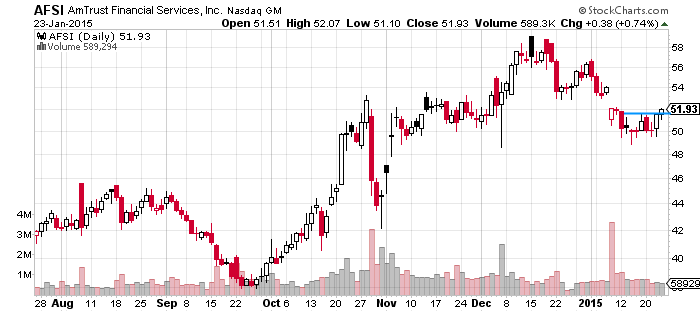
AmTrust Financial Services, Inc. (AFSI) is in a strong uptrend and recently pulled back to minor support near $50. The stock paused in this area from Jan. 14-22, ranging between $48.85 and $51.57. On Jan. 23, the price broke above this consolidation, indicating another potential advance. Buy near $51.60, with a stop loss below the consolidation low. A conservative price target is $58; a more aggressive target is $61, beyond the Dec. $59.31 high.

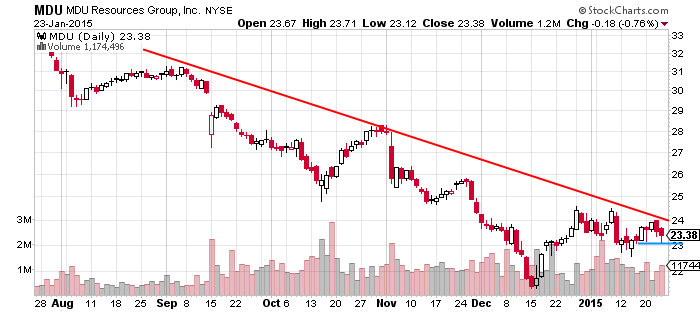
MDU Resources Group Inc. (MDU) is in a downtrend, channeling lower since the start of July. In mid-December the stock rallied to the top of the descending trend channel and has been consolidating there since. A drop below $23.10 pushes the price below a portion of that consolidation and could be enough to trigger more selling moving the price back toward the channel bottom. A stop loss goes above $24, the Jan. 22 high, or alternatively, above $24.58, the Dec. 29 high. The target for the next wave lower is $20.75; a more aggressive target is $20.


The Bottom Line

Swing trading provides a way to capture moves which could last a couple days to a couple weeks (sometimes longer). There are multiple ways to capture moves, such as breakouts, buying bounces off support during an uptrend, or shorting when the price declines off resistance in a downtrend. Stop loss orders help limit risk, but losses can still be bigger than expected if the price gaps through the stop loss price. Profit targets are used as a way to make risk/reward assessments before a trade is made. Alternatively, use a trailing stop. Sometimes a trailing stop will result in larger gains than a profit target, but other times the profit target will work better. Choose a profit taking method when you create your swing trading plan, then stick to it.

Choosing a Stock Broker for Your Online Stock Trading


Digital stock market listings - Comstock/Stockbyte/Getty Images
Comstock/Stockbyte/Getty Images

If you haven't already opened a brokerage account with a respected stock broker, there's no point in reading any further. Instead, you should take a moment to go through our guide to choosing a stock broker. It will help you open an account so you can begin trading stocks. Once you've done that, you can come back here and continue with the Stock Trading Guide. Find out how to open a brokerage account with a stock broker ...

Understanding Your Brokerage Account and Statement

The best way to start investing is to open a brokerage account with a well-respected stock broker. Here, we'll explain how commissions work, what is considered "reasonable", and what you should expect

How To Read Your Stock Broker Trade Confirmations

Whenever you buy or sell an investment through your brokerage account, you are going to receive a special document called a trade confirmation from your stock broker. There are certain things you need to check on each and every trade confirmation you receive or you could end up losing a lot of money. Find out what to check on your brokerage confirmation reports

How Do I Choose a Stock Broker or Brokerage Account?

Now that you know the basics of how brokerage accounts work and why trade confirmations are important, it's time for you to set out to find your own, personal stock broker. There are two types of stock brokers in the world - full service stock brokers and discount stock brokers. They each have pros and cons. How do you know which one is right for you? Here are some things to consider

What's So Special About Full Service Stock Brokers and Brokerage Firms?

With their mahogany paneled walls, gourmet coffee, and tailored stock recommendations, full service stock brokers can cost a lot of money through higher fees, service charges, and commissions. But, in some cases, their research and planning help is worth every penny. Just what services do full service brokers and full service brokerage firms offer?

Are There Any Fees I Should Refuse to Pay My Stock Broker?

There are a few fees that are so outrageous, yet common among some stock brokers, brokerage firms, and banks that you absolutely must know about them. Take a minute to educate yourself and if you find your accounts with a broker that insists on charging them, take your business elsewhere. They are going to nickel and dime you for every penny you have to your name.